A health institute that has been making national and state COVID-19 forecasts revised its model for Ohio, suggesting that the peak will be hit Wednesday, leaving far fewer cases and deaths than the gruesome numbers painted by Gov. Mike DeWine’s administration.
The Sandusky Register reported on the model update Monday.
The forecaster is the University of Washington’s Institute for Health Metrics and Evaluation (IHMC), and it is a model that has been cited by many state and federal officials, including President Donald Trump.
The new forecast says Ohio’s COVID-19 outbreak will peak in its effect on hospital resources tomorrow and will peak in daily deaths on April 12, the Register said. It predicts 544 coronavirus deaths by Aug. 4.
The Ohio model is available here.
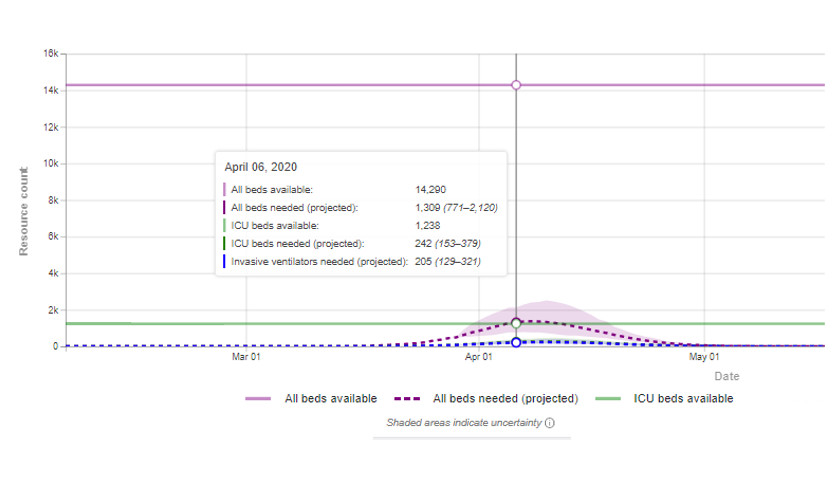
The model estimates the dates at which hospital resources like beds and ventilators will be most needed, which it says is tomorrow. The model says Ohio has 14,290 available beds, and as of tomorrow will be using only 1,372 beds.
There are 1,238 ICU beds in Ohio, and as of tomorrow, only 262 will be needed. Only 223 invasive ventilators will be necessary tomorrow.
The Ohio Star has extensively reported on the lack of transparency involved in the decisions by DeWine and Ohio Department of Health Director Dr. Amy Acton in shutting down the state for two weeks and sending hundreds of thousands to unemployment lines.
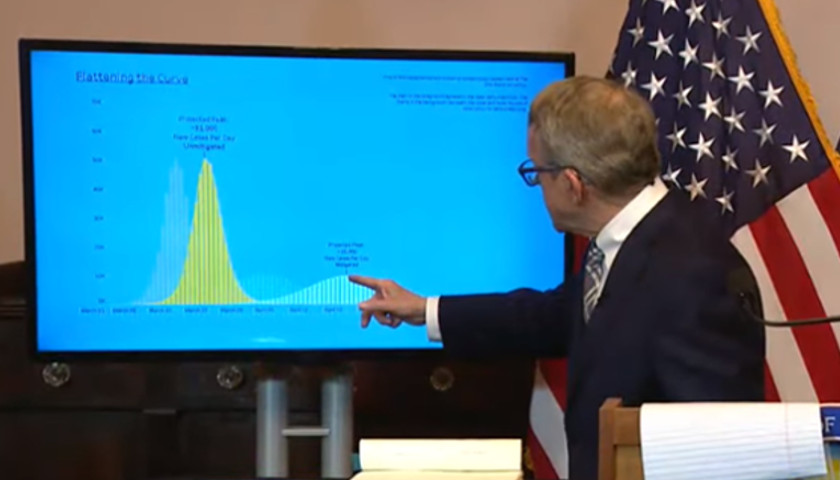
According to a Monday story, the state is under a stay-at-home order until May 1, five days after Acton says will be the peak — April 25. Acton’s slides shown at presentations keep sliding around, with one showing the murky data comes from Ohio State University’s Infectious Disease Institute (IDI). However, ODH has not specifically named the epidemiologists who are responsible for the data in the projections, nor has it provided any details on the assumptions and methodology behind these projections.
The most recent slide suggests there would have been around 2,000 new cases this past Sunday, when there were only 304, according to data from the OHD website, as tracked in the COVID-19 project website.
On March 26, Acton said there could be up to 8,000 new cases a day by May 1.
– – –
Jason M. Reynolds has more than 20 years’ experience as a journalist at outlets of all sizes.


Really? This is great news and it due to the fact that the governor was being proactive. Your article is so negative! The numbers would have been awful had this action not been taken. Our hospital would have been stretched to the brink. I’m sure if Dewine wouldn6have taken this hard stance you would complain as well SHAME ON YOU!
Corelation is not causation. Statistics 101.
To make your claim anything more than partisan cheerleading, you need to provide a counterfactual example to compare DeWines draconian actions against.
Do you have such a counterfactual?
I AGREE WITH YOU. I WOULD RATHER HAVE OUR GOVERN MIKE DEVINE IN CHARGE. HE IS DOING WHAT IS BEST FOR THE PEOPLE.
THANK YOU FOR YOUR SERVICE. PROUD TO HAVE YOU FOR OUR GOVERN. STAY SAFE
Other than your belief, what evidence can you produce that DeWine’s actions “worked”, especially without knowing the costs?
Agree with the above comments, the outcome is much better because of the quarantine and other steps taken to flatten the curve. Why would we be unhappy that the numbers are lower than projected? Dr Acton even said at the start I hope we can look back and say our projections were wrong because we took the appropriate steps.
What is your evidence for making such an assertion?
I have been trying to track the state’s actual daily cases against the daily mitigated projections that it has on the ODH Dashboard (the chart with the huge orange curve and the “flattened” blue curve). I made a spreadsheet on April 2 and tracked and charted the data for all of the days for which actual daily case count data is available, starting back in February. It is extremely hard to track the data BECAUSE, the State’s HISTORICAL “Total Count and Daily Count” values change almost daily. How can history change? It took me a couple of hours to plug in all of the figures as of April 2, only to find that almost every historical number, going back to February, had changed as of April 4! And again, they changed on the 5th. Since I am one of the lucky Ohioans who still has a full-time job, at least for now, I don’t have time to go back and revise these all the time. The resulting curve of actual data (regardless of how it is revised) compared to projected data on daily new case count is MINISCULE. I don’t understand why the state doesn’t plot the actual data on the same chart with its “unmitigated” and “mitigated” curves?? I would think the state would be very proud of the NEARLY FLAT (not flattened) curve!!! The “actual data’ curve is so small that it barely shows up plotted against even the “mitigated” curve.
The national debt is going to be reset. In order to do this there must be a crises. The government wouldn’t give away 2 trillion dollars unless this was their plan. The printing presses are running 24/7. They can’t print fast enough. You will still owe your personal debt so dont think you will be getting a free ride.
As of 4/7/20 U.S. death toll tops 10,000. As for regular seasonal flu data derived from last five years indicates an average of 30,000 deaths. These numbers do not show corona to be more contagious .
The less-than-projected numbers are a direct result of the stay-at-home order and other social distancing precautions taken by Governor Dewine and Dr. Acton. This was the desired result. I’m not sure why this is being painted in a negative light. This is good news for our state. Speaking as a healthcare worker, this is even better news for our hospitals.
I absolutely agree with you. Why would anyone be upset with these outcomes.
Well, the people payng the costs of those draconian commands for one. Especially ic you assume without evidence those actions did anything to limit the virus in any meaningful way…
As of 4/7/20 U.S. death toll tops 10,000. As for regular seasonal flu data derived from last five years indicates an average of 30,000 deaths. These numbers do not show corona to be more contagious . These figures regarding the regular seasonal flu were determined before the social distancing order was in place.
or it could be that spring time is here
it’s painted as a negative light because the Economy is being trashed, by being closed until May 1st based on these numbers.
Maybe we should open the Restaurants back up and get people working again.
I agree with you Mike!
As a healthcare worker, you appreciate the need for evidence before making a conclusion, or a diagnosis. What evidence backs your belief that DeWine and Acton’s gross exaggeration of the bad outcomes led to productive outcomes?